Technical Projects
Below is a selection of data science projects demonstrating my end-to-end capabilities, from raw data engineering to statistical modeling and stakeholder presentation.
1. Credit Card Customer Segmentation
Tools: Pandas, NumPy, Matplotlib, Seaborn, Scikit-learn, Kneed Status: Ongoing Research
The Challenge
Credit card companies struggle to personalise marketing or identify risk within diverse, unlabelled datasets. The challenge was to uncover natural customer groupings using unsupervised learning to reveal hidden behavioural patterns and improve retention
The Solution
A full unsupervised learning pipeline was developed to discover meaningful customer segments. The approach included:
- Applying multiple clustering algorithms
- Identifying representative customer profiles for each segment
This strategy ensured robust segmentation and deeper insight into customer behaviour.
Key Technical Achievements
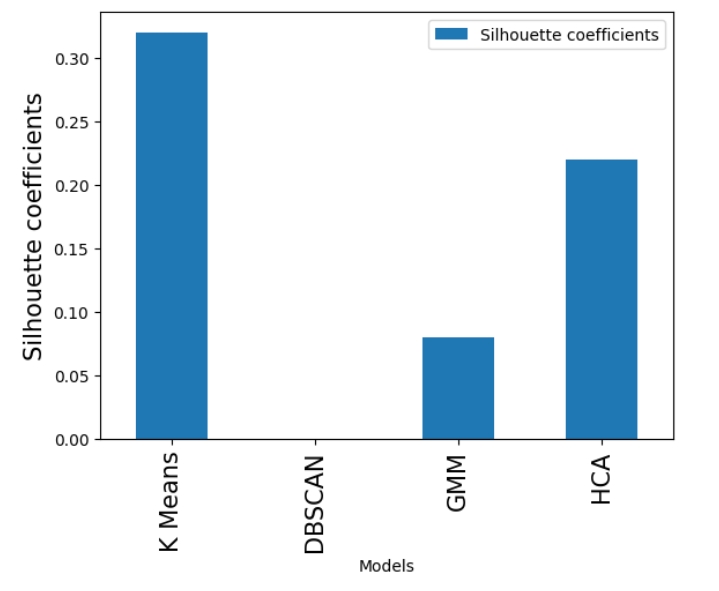
- Built a full clustering pipeline (K‑Means, DBSCAN, GMM, HCA) with robust preprocessing and scaling.
- Identified K‑Means as the optimal model (Silhouette Score: 0.32), while detecting that DBSCAN and GMM failed to form distinct clusters on this dataset.
- Evaluated models using silhouette scores, inertia, PCA visualisations, and the Davies-Bouldin Index.
- Produced clear customer segments with actionable business insights.
Code Snapshot
A snippet demonstrating the initialization of the location and model parameters:
#| code-summary: "View Hybrid PCA Code"
from sklearn.decomposition import PCA
from sklearn.preprocessing import StandardScaler
import numpy as np
import pandas as pd

# 1. Retain critical features, that are essential for risk profiling (Ensures interpretability)
direct_features = ['ONEOFF_PURCHASES', 'BALANCE', 'PAYMENTS','CREDIT_LIMIT', 'CASH_ADVANCE']
remaining_features = [col for col in df3.columns if col not in direct_features]

# 2. Apply PCA only to the redundant features
pca = PCA(n_components=6) # Retaining 95% variance
principal_components = pca.fit_transform(scaled_remaining_features)

# 3. Combine critical Features + PCA Components
final_data = np.hstack([scaled_direct_features, principal_components])
final_df = pd.DataFrame(final_data, columns=direct_features + [f'PC{i+1}' for i in range(6)])
2. Global Rehabilitation Analysis
Tools: Power BI, SQL, DAX Status: Ongoing Research
The Challenge
Global health systems lack clear, accessible insight into rising rehabilitation needs. Disease burden varies widely across regions and conditions, yet policymakers struggle to interpret complex DALY data and identify where services are most needed. The challenge was to turn high‑dimensional global health metrics into clear, trends,and find gaps in the system—through interactive, Power BI dashboards.
The Solution
Full unsupervised learning pipeline to discover meaningful customer segments. The approach included:
Extracting and transforming data using SQL. Developing dynamic DAX measures for real-time analysis. Designing user-friendly dashboards for non-technical stakeholders.
This strategy ensured robust segmentation and deeper insight into customer behaviour.
Key Technical Achievements
- Transformed complex health datasets into an intuitive relational data model.
- Implemented advanced DAX calculations to quantify disease burden across varying demographics.
- Designed interactive visuals (maps, heatmaps) to highlight regional disparities.
- Enabled stakeholders to drill into specific conditions and geographies instantly.
Power BI Snapshot
Executive summary with KPIs- Loading…
3. Web Funnel & A/B Testing Analysis
Tools: Python, Pandas, Plotly, SciPy Status: Completed
The Challenge
Web products often collect large volumes of event‑level data, yet teams struggle to interpret how users move through the conversion journey. Identifying where users drop off, which traffic sources bring high‑intent visitors, and whether product variants improve conversion requires structured analysis. The challenge was to transform raw event logs into a clear funnel model and evaluate product performance using statistical methods.
The Solution
A full analytical workflow to model user progression and assess variant effectiveness. The approach included:
Constructing a multi‑step conversion funnel. Quantifying drop‑off rates and source‑level conversion performance.
Evaluating product variants using Chi‑Square testing and Bayesian inference.
This provided a transparent view of user behaviour and a statistically grounded assessment of the A/B experiment.
Key Technical Achievements
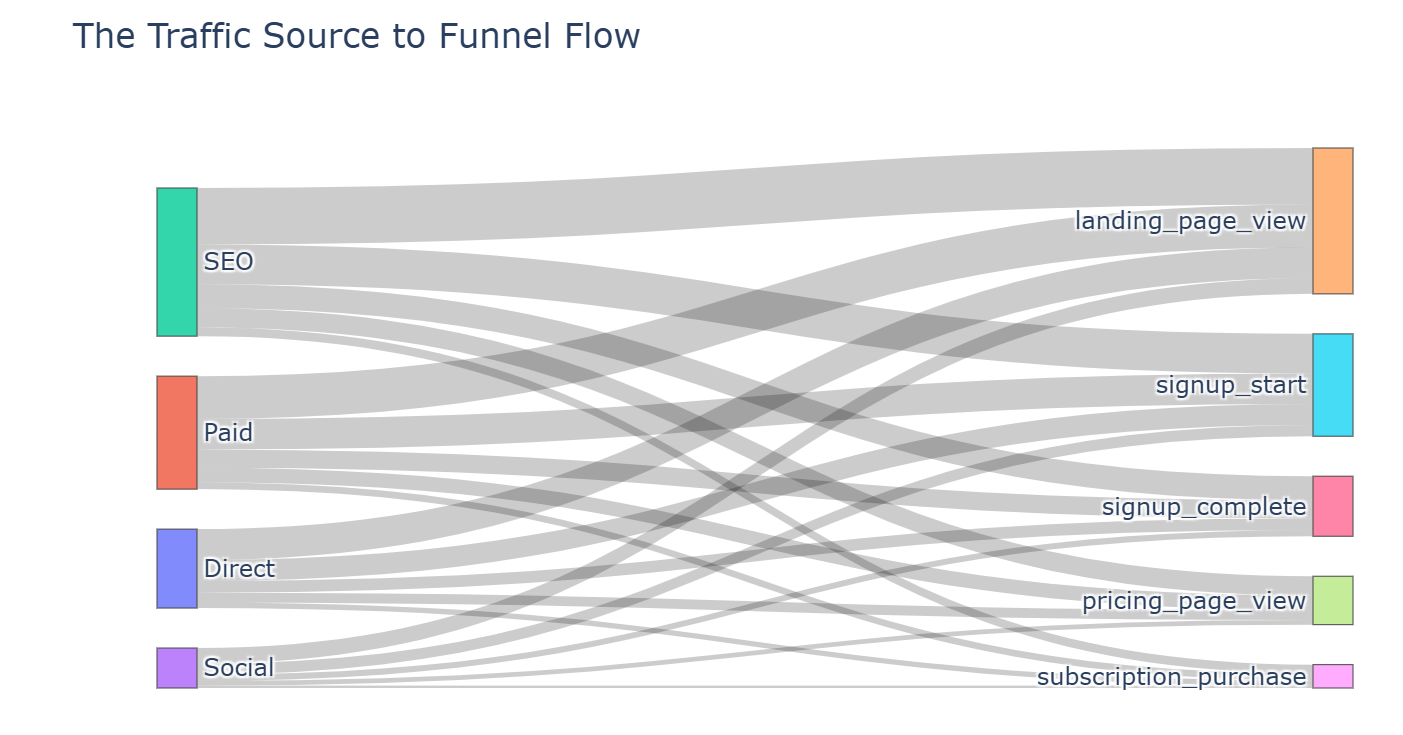
Built a structured funnel model to measure user progression and identify major drop‑off points.
Calculated conversion rates across acquisition sources to assess traffic quality.
Implemented both frequentist and Bayesian A/B test frameworks for robust variant evaluation.
Developed interactive visualisations (Sankey diagrams, bar charts) to communicate findings effectively.
Code Snapshot
Code shows how the Frequentist Evaluation was implemented
#| code-summary: "Chi‑Square A/B Test Code"
from scipy.stats import chi2_contingency
import pandas as pd

# 1. Build exposure and conversion table for each variant
table = [
    [ab_df.loc["A", "converted"], ab_df.loc["A", "exposed"] - ab_df.loc["A", "converted"]],
    [ab_df.loc["B", "converted"], ab_df.loc["B", "exposed"] - ab_df.loc["B", "converted"]],
]

# 2. Run Chi‑Square test to evaluate statistical significance
chi2, p, dof, expected = chi2_contingency(table)

# 3. p-value interpretation:
*p < 0.05 → statistically significant difference*
*p ≥ 0.05 → no evidence that variants differ*

p